Optimising 3D Asset Creation: A Case Study in Automating Photogrammetry Workflows
- Admin Godel
- Jul 29, 2025
- 4 min read
Photogrammetry is a science and technology that extracts reliable information about physical objects and the environment through the process of recording, measuring, and interpreting photographic images. By capturing an object from multiple viewpoints, software like Agisoft Metashape can reconstruct it into a detailed 3D model. This technology has wide-ranging applications, from geographical mapping and cultural heritage preservation to industrial inspection and visual effects. This case study focuses on its application in industrial wear and tear analysis, where precision and efficiency are paramount.

Client Background
The client specializes in creating high-fidelity 3D digital twins of industrial components for precise wear and tear measurement. Their competitive edge lies in an end-to-end automated pipeline that allows field operators to simply capture video footage of an object with a standard smartphone. This video is then processed automatically to produce a detailed 3D asset, streamlining a traditionally complex process.

Challenge / Problem Statement
The client's automated pipeline was built on a single, monolithic script. While functional, it was rigid and inefficient. The primary challenges were:
Frequent Failures: Processing runs often failed or produced low-accuracy models due to suboptimal input parameters or poor video quality.
Wasted Compute Time: When a run failed, the entire process had to be restarted from the beginning, consuming significant compute resources.
Manual Intervention: In the headless processing mode, designers had to manually sift through dense log files to diagnose issues, tweak parameters, and relaunch the job. This iterative, trial-and-error approach created a major bottleneck, demanding extensive human oversight and causing operator fatigue.

Objectives
The project was initiated to overhaul the existing pipeline with the following goals:
Significantly reduce the compute time required for generating 3D assets.
Minimise the need for manual operator intervention and reduce human error.
Create a flexible and modular framework that allows for greater control and experimentation

Solution Overview
The monolithic script was re-architected into a modular, Object-Oriented Programming (OOP) framework. This new system dismantled the single, linear process into a series of independent, interoperable stages.
The key features of the solution include:
Modular Process Control: The new framework allows operators to start, stop, and resume the workflow from any individual step. If an error occurs during mesh generation, for example, the operator can adjust parameters for that specific stage and rerun it without reprocessing the initial, time-consuming steps.
Parallel Experimentation: The solution enables a Design of Experiments (DoE) approach. Operators can run multiple versions of a single stage in parallel with different custom configurations, allowing them to quickly identify the optimal parameters for the highest quality output.
Technical Challenges
The primary technical hurdle was building an intelligent control layer on top of the native software's API.
Log Parsing and Interpretation: The logs generated by the core photogrammetry software were cluttered and not designed for automated decision-making. We developed a custom logger to parse these verbose outputs in real-time and extract only the critical metrics needed to assess the health of the process.
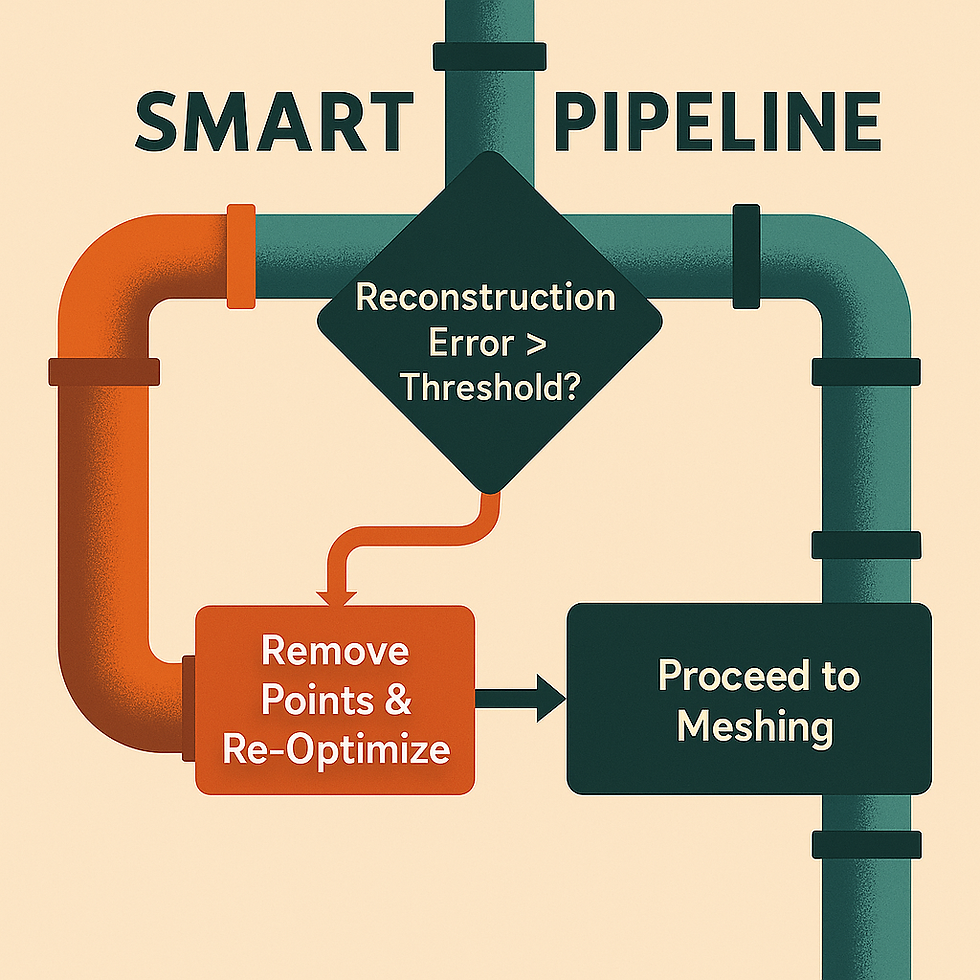
Dynamic Workflow Graph: The system required a fluid, intelligent workflow that could make decisions on the fly. For example, if the custom logger detects a high reconstruction error after the initial point alignment, the framework is programmed to automatically trigger a sub-routine to remove outlier points and rerun the optimisation step. Programming this non-linear, adaptive logic was a significant challenge.
Architecture
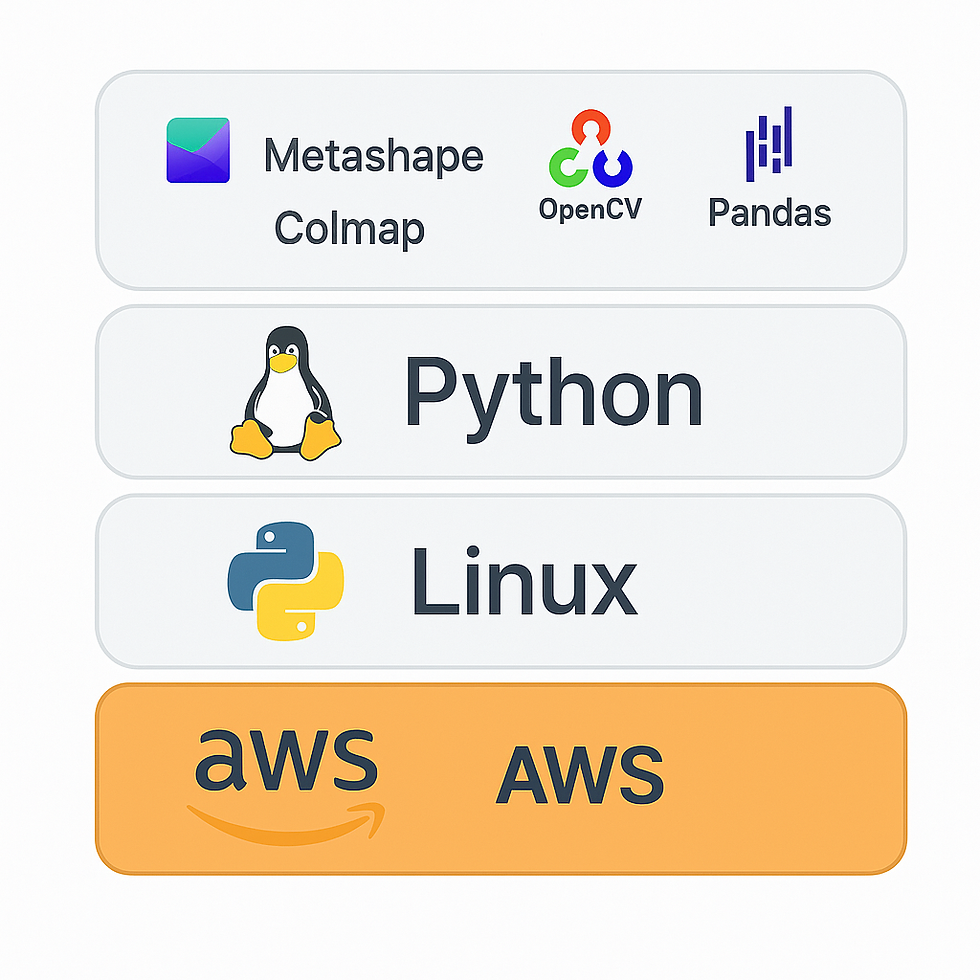
The solution is built on a modern, scalable tech stack:
Platform: AWS, Linux
Core Language: Python
Key APIs & Packages: Agisoft Metashape, ColMAP, OpenCV, Pandas
The architecture follows a unidirectional graph paradigm. This structure provides users with fine-grained control over all available parameters for each processing step while ensuring a logical, forward-moving workflow. The revamped logging module feeds directly into the graph's decision points, and key log data is converted into plots to give operators an immediate visual understanding of process quality, making decision-making faster and more intuitive.

Results & Impact
The implementation of the new framework yielded significant and measurable improvements:
55% Reduction in Compute Time: By eliminating the need for full restarts, the optimized workflow cut machine processing time by more than half. On AWS, this translates to a direct compute cost saving of approximately 55% for the instances used (e.g., those with 16GB VRAM and 32GB DRAM).
80-85% Reduction in Human Operator Time: Automating the diagnosis and restart process freed up designers from tedious log analysis and manual intervention, drastically reducing fatigue and allowing them to focus on higher-value tasks.

Insights
This project reinforced several key principles of scalable software development. First, refactoring cluttered, monolithic code is not just a cleanup exercise; it democratizes the tool, making it more accessible and accelerating future development cycles. Second, when a company scales, the default solution is often to horizontally scale the number of machines, which can lead to massive and unsustainable cloud computing bills. This project proved that periodically revamping core processes for algorithmic efficiency is a far more cost-effective and sustainable strategy for growth.

Conclusion & Next Steps
By transforming a rigid, inefficient script into a modular and intelligent framework, we delivered immediate and substantial value to the client. The project not only achieved its primary objectives of reducing compute and operator time but also established a robust, scalable foundation for future innovation. The next steps could involve integrating machine learning to predict optimal parameters based on initial video quality analysis, further reducing the need for any human-guided experimentation and moving towards a fully autonomous system.
Appendix
Step-wise Time Distribution and Failure Rates
Pipeline Step | Typical Time % | Failure Rate | Computational Intensity |
Feature Detection | 10-15% | ~5% | Low-Medium |
Feature Matching | 15-20% | ~15-20% | Medium |
Sparse Cloud | 15-20% | ~10-15% | Medium |
Depth Map | 20-25% | ~10% | High |
Dense Reconstruction | 25-35% | ~8-10% | Very High |
Model Builder | 10-15% | ~5% | Medium |
Comments